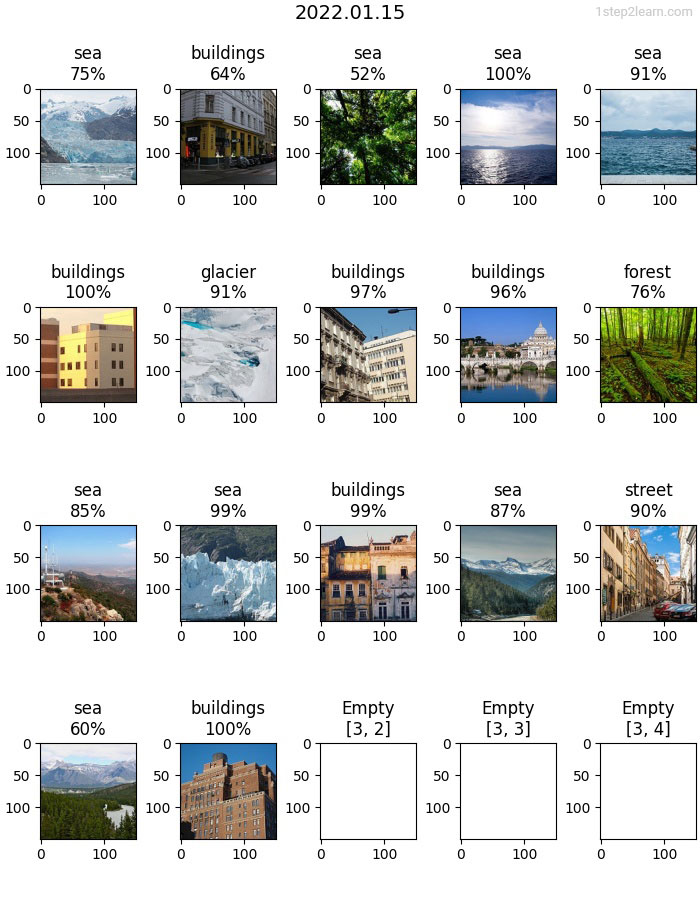
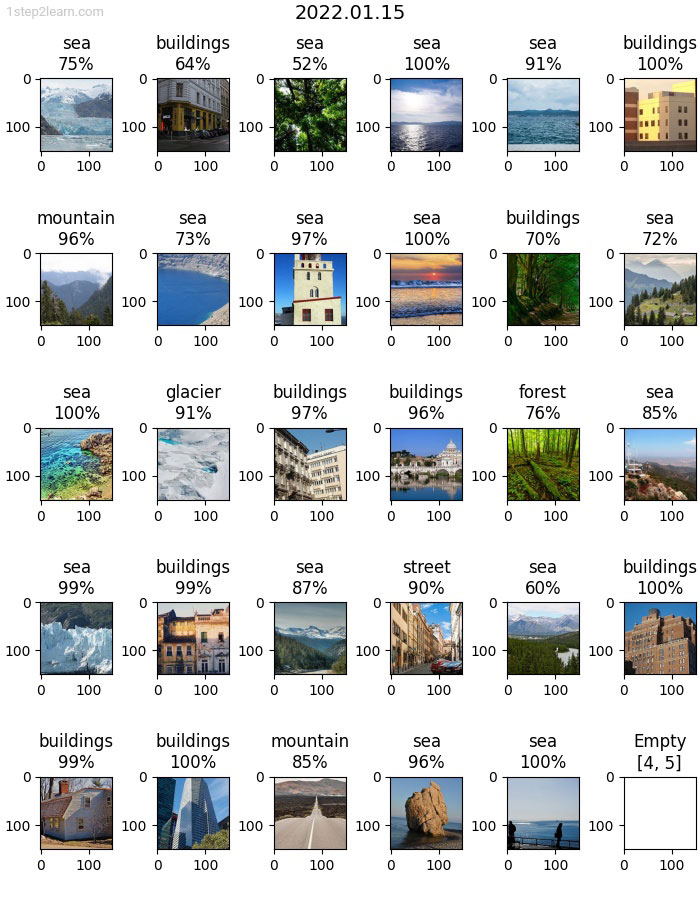
Creating Multiple Subplots With Matplotlib Python
How to create matplotlib plot with multiple columns and rows in one plot (matrix shape).
Introduction
When evaluating the performance of a machine learning model, it is often useful to have a visual representation of the results.
In some cases, you may want to produce a small report that includes multiple plots arranged in a matrix format, without having to manually arrange the plots or interact with the user interface.
To address this need, the following function provides a convenient solution for plotting a matrix of subplots using the data from a pandas DataFrame.
The function allows you to easily arrange the plots in a matrix format, without having to worry about configuring the plot or interacting with the user interface.
This function offers a simple and efficient way to produce a small visual report of the performance of a machine learning model, allowing you to focus on analyzing the results and making informed decisions, rather than spending time on manual plot arrangement and user interface interactions.
Code
import datetime
import os
from matplotlib import pyplot as plt
from PIL import Image
def create_multiple_subplots(df, images_path):
"""
Creating multiple subplots with matplotlib
:param df: dataframe [image, probability, class]
:param images_path: local path of the images (example: 'input/images')
:return: None, show and save the plot
"""
date_now_str = datetime.datetime.now().strftime('%Y.%m.%d')
total_images = len(df)
total_root = int(math.sqrt(total_images))
root_power = total_root ** 2
root_rest = total_images - root_power
cols= total_root
rows = total_root
if 0 < root_rest <= total_root:
cols = cols + 1
fig, axs = plt.subplots(ncols=cols, nrows=rows, figsize=(7, 9), constrained_layout=True)
image_index = 0
for i in range(rows):
for j in range(cols):
ax = axs[i, j]
if image_index < total_images:
print(image_index)
img = Image.open(os.path.join(images_path, df['image'].iloc[image_index]))
ax.set_title(df['class'].iloc[image_index] + '\n' + float_to_str(df['probability'].iloc[image_index]))
ax.imshow(img)
else:
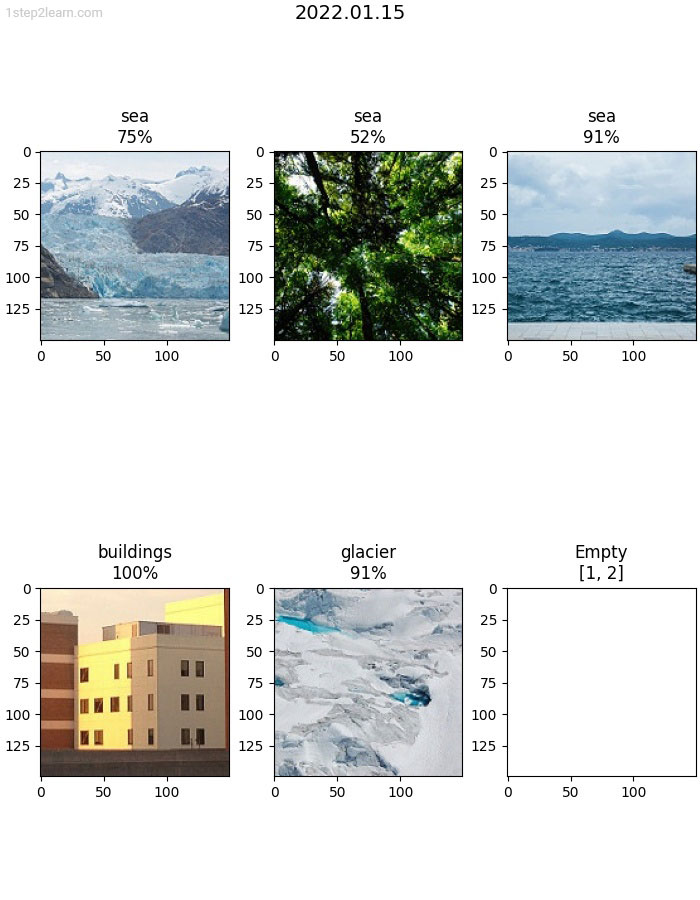
ax.set_title('Empty\n' + '[' + str(i) + ', ' + str(j) + ']')
img = Image.open(os.path.join(images_path, df['image'].iloc[0]))
width, height = img.size
blank_img = Image.new('RGB', (width, height), (255, 255, 255))
ax.imshow(blank_img)
image_index += 1
fig.suptitle(date_now_str, fontsize=14)
plt.show()
fig.savefig('/test-results-' + date_now_str + '.jpg')
Explanation
This code defines a function "create_multiple_subplots" which generates multiple subplots using the Matplotlib library and saves it as an image file.
The function takes two arguments:
- df: a pandas DataFrame containing three columns 'image', 'probability', and 'class'.
- images_path: a local path to the images.
The first section of the code imports the necessary libraries, including datetime for working with dates, 'os' for interacting with the file system, pyplot from matplotlib for plotting the subplots, and Image from 'PIL' for working with image files.
The function starts by generating a date string to use as the title of the plot. Then, it calculates the number of images to be plotted, the number of columns and rows needed to arrange the subplots, and sets up the subplots using the 'subplots' function from 'matplotlib'.
Next, the function loops through each row and column of the subplots and adds a plot to each subplot. If there are fewer images than subplots, it will add empty subplots to fill the remaining spaces.
For each subplot, the function opens the corresponding image from the 'images_path' using the 'Image.open' method, sets the title of the subplot using the values from the df DataFrame, and adds the image to the subplot using the 'imshow' method.
After adding all the subplots, the function sets the title of the whole plot using the generated date string and shows the plot using the 'show' method. Finally, the function saves the plot as an image file in the local file system.
Summary
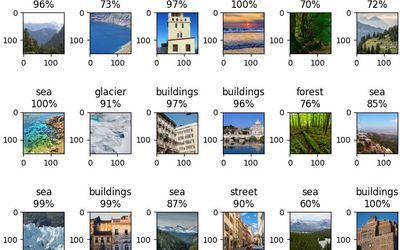
Creating multiple subplots with Matplotlib can be useful in computer vision projects when you want to visually compare or inspect multiple images or visualizations side by side.
It allows you to arrange multiple images or plots in a matrix form and provides a compact way to display a large number of images or plots in a single figure.
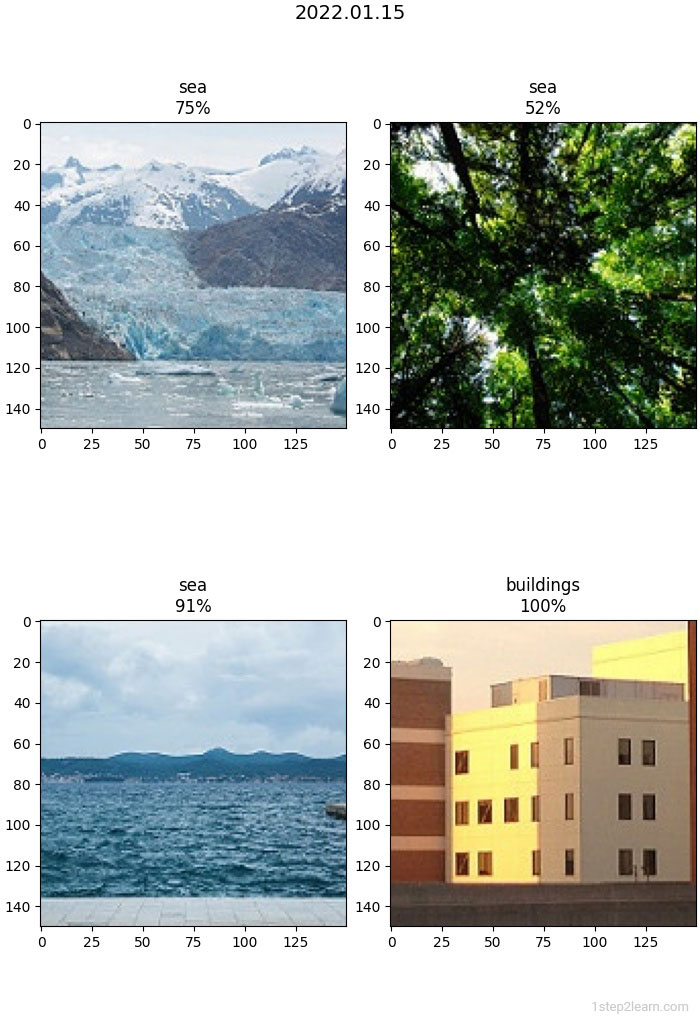
For example, in a machine learning project, you may want to visualize the results of a model's predictions on a test dataset. By using multiple subplots, you can display multiple images with their predicted class labels and confidence scores in a single figure.
This can help you quickly inspect the performance of the model, identify any errors or mistakes in the predictions, and make adjustments to the model if necessary.
In general, using multiple subplots allows you to visually compare and analyze different aspects of the data in a compact and organized manner, making it an important tool for data exploration and analysis in computer vision projects.
References
Related Articles